See where your network hurts.
LinkPulse probes every device and route you depend on, graphs latency and packet loss hop by hop, and tells you the moment something drops. Built for live events and broadcast. Useful anywhere there is a network.
Free. Windows, macOS and Linux. No installer. Sign in with Google or your email to download.
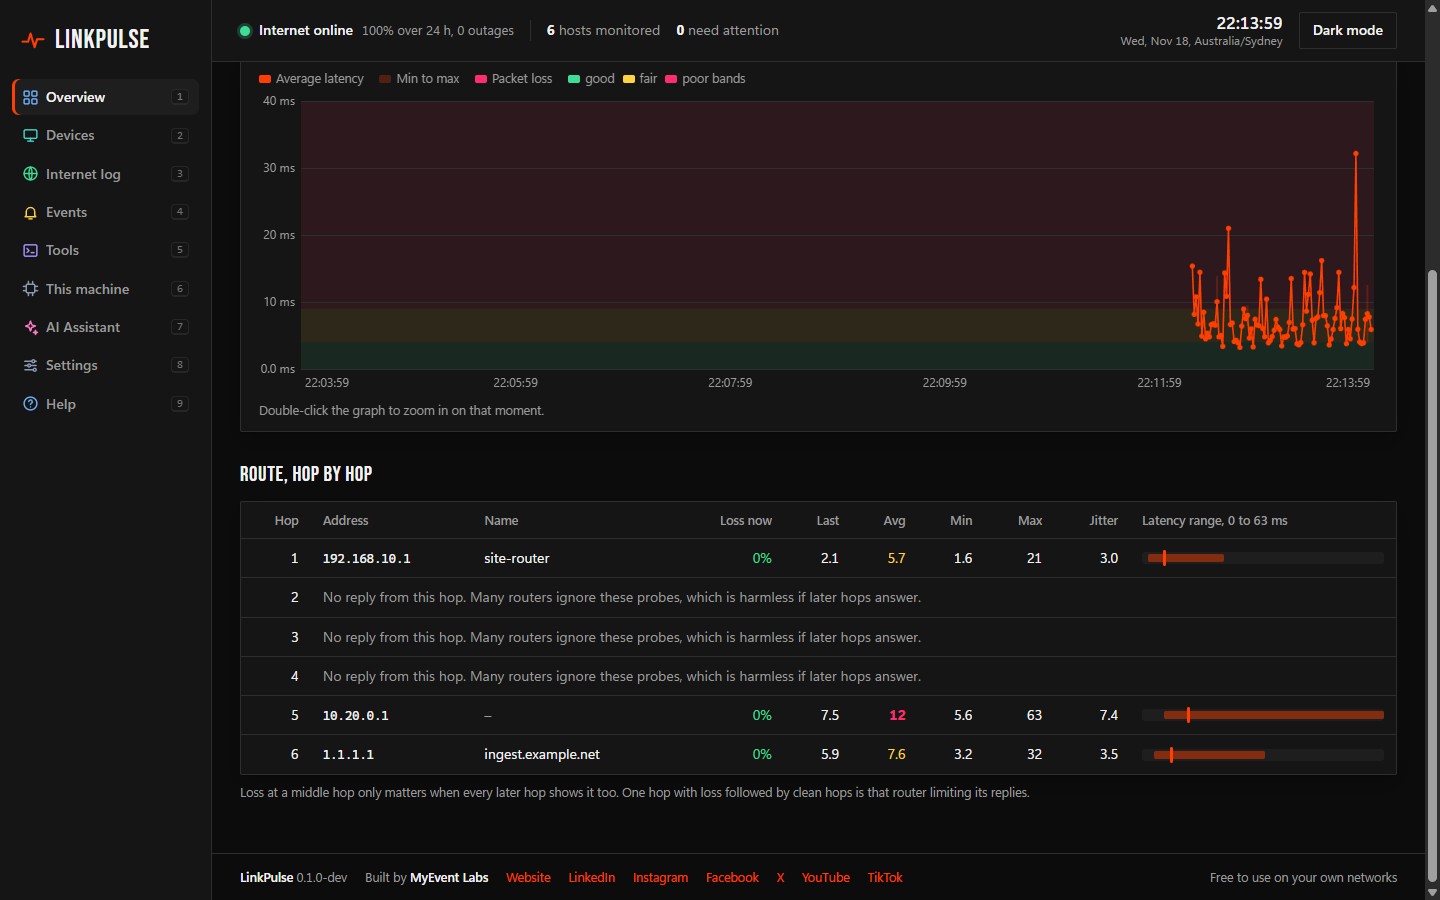
Sample data. Loss starts at hop 4 and carries through to the destination, so hop 4 is the one to call your provider about.
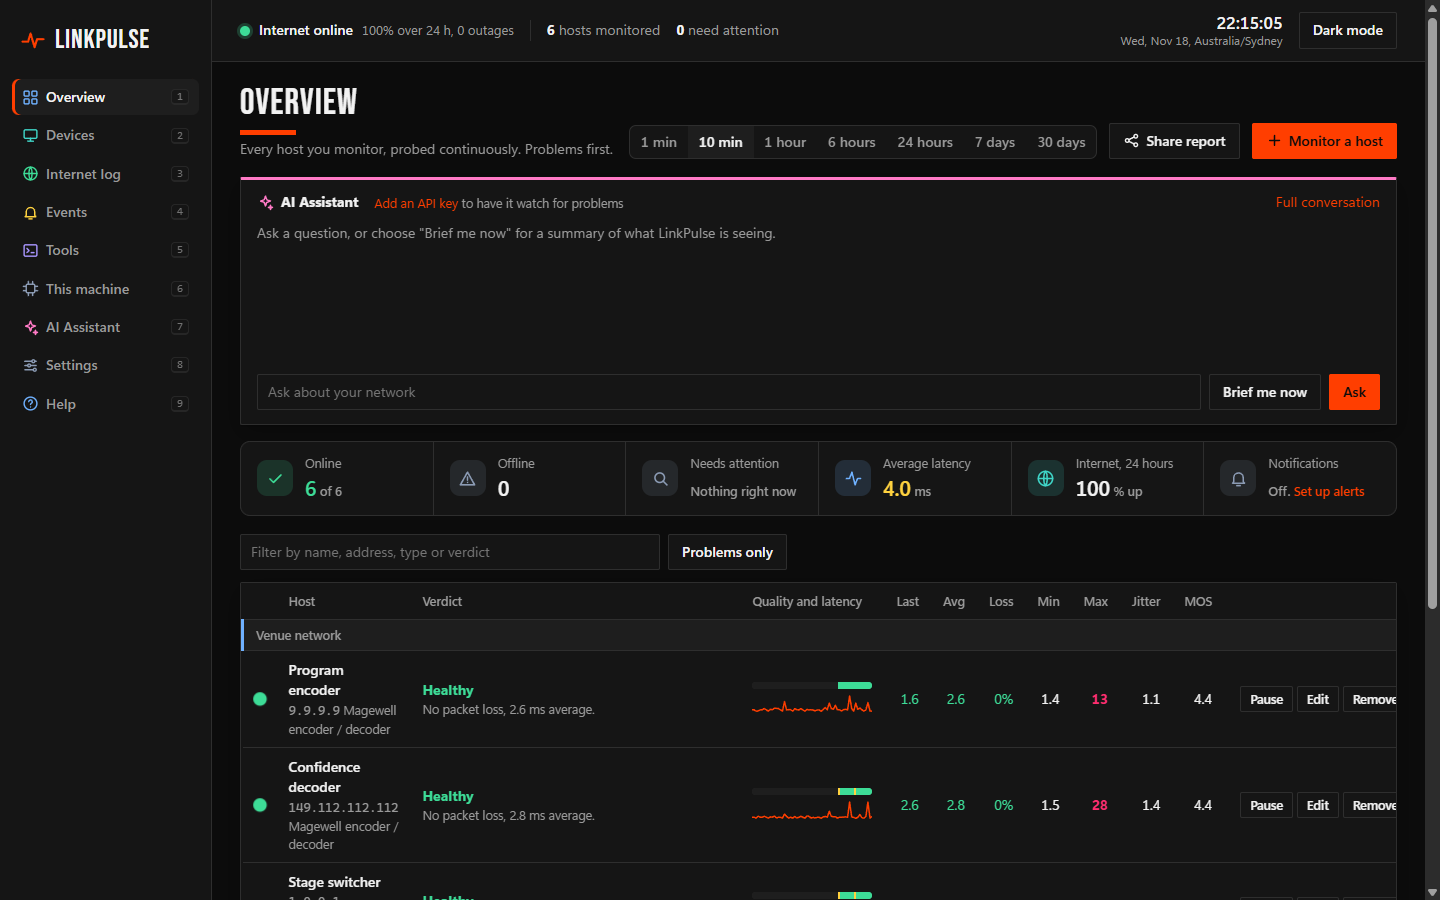
What it looks like
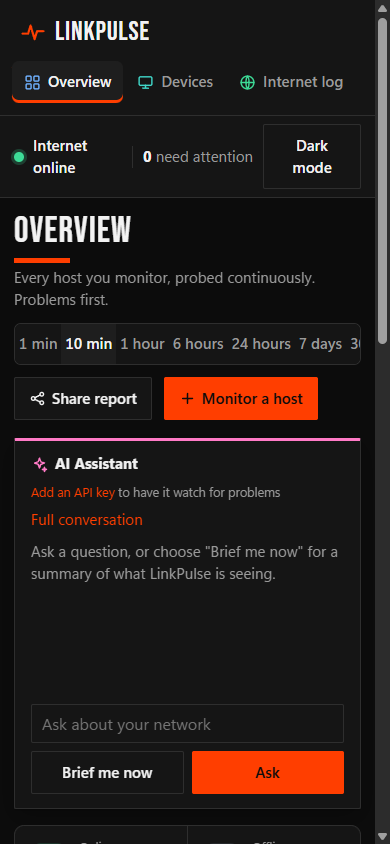
Real screens from the app, shown with sample host names and addresses.
One tool for the whole network
Everything you reach for when a stream stutters or a device goes quiet, in one small program.
Plain-language verdicts
Every host gets a diagnosis anyone can read: healthy, or what is wrong and at which hop. Loss that is only a router limiting its replies is ignored, so it never raises a false alarm.
Reports you can send
Share a report as PDF, Excel, CSV, Markdown or a web page, or email it straight from the app. It states the verdict with the evidence, ready for your ISP or IT team.
Thirty days of history
Colour-coded timelines from one minute to thirty days, with double-click zoom into any moment.
Route monitoring, hop by hop
Latency, jitter, packet loss and call quality for every target, with a timeline you can scroll back through and a route table that shows which hop is at fault.
Find every device
Scan a network in seconds. Each device is identified by maker, name and the services it answers on, including Magewell and Blackmagic Design encoders and decoders.
Know the moment it drops
Online and offline alerts by email, Slack, Microsoft Teams, WhatsApp or any webhook, with optional latency and loss thresholds.
An honest internet log
Every outage recorded with its start, end and length, plus uptime over the last day. Proof for your provider, or peace of mind.
The tools you keep reaching for
Ping, trace route, DNS lookup, port check, Wake-on-LAN and a speed test, alongside your machine's own network settings and time of day.
A live network map
Your local network and the internet drawn as a map, with every device found and every host you monitor, coloured by live status. Drag, zoom, and click any device to open it.
An AI assistant that reads the graphs
Ask what is wrong in plain words. It reads your live routes, outages and events, using your own key from Anthropic, OpenAI, Google, OpenRouter or a local model.
Desktop, server or terminal
Run it on your laptop, on a server with a password, in Docker, or as a live dashboard in the terminal. Light and dark mode. Updates itself.
Your data stays yours
One free sign-in, with Google or your email, is all the account there is. Your hosts, addresses, device names and logs never leave your machine: they are plain CSV and JSON you can open in anything. LinkPulse sends anonymous usage counts only (installs, launches, which features get used), and one switch in Settings turns that off.
At home in the terminal
The same engine drives a full command line. Scan a site network before doors, watch your encoders during the show, and pipe JSON into your own scripts.
$ linkpulse scan
  14 devices on 192.168.10.0/24 (2.4s)

  IP             VENDOR               WHAT IT LOOKS LIKE          PING
  192.168.10.1   DrayTek Corp.        Router / gateway             0.5
  192.168.10.21  Nanjing Magewell     Magewell encoder / decoder   0.8
  192.168.10.22  Nanjing Magewell     Magewell encoder / decoder   0.9
  192.168.10.40  Blackmagic Design    Blackmagic Web Presenter     1.1
  192.168.10.63  Apple, Inc.          Apple device                 2.0

$ linkpulse watch 192.168.10.21 ingest.example.net
 ● 192.168.10.21        0.8   0.9   0.6   2.1   0.0%  ▁▁▂▁▁▁▃▁▁▂▁▁
 ● ingest.example.net    41    38    29    74   0.0%  ▃▄▃▅▃▄▆▄▃▄▅▄
Download
One file per system. Run it and the dashboard opens in your browser.
Downloading asks you to sign in first, with Google or a code sent to your email, and the app asks once more the first time it opens. We keep your name and email so we can tell you about updates and fixes, and for nothing else.
| Windows 10 and 11 | 64-bit (most PCs)ARM |
| macOS | Apple siliconIntel |
| Linux | x86-64ARM64 |
Windows: double-click the file. If SmartScreen appears, choose "More info", then "Run anyway".
macOS and Linux: open a terminal in your downloads folder and run chmod +x linkpulse_*, then ./linkpulse_darwin_arm64 (or the file you downloaded). On macOS, run xattr -d com.apple.quarantine linkpulse_darwin_arm64 first.
Verify a download against checksums.txt. LinkPulse is free to use under the freeware licence. Only monitor networks you own or are authorised to monitor.
Found a bug? Want a feature?
LinkPulse is shaped by the people who use it on real jobs. Report a bug, suggest an improvement or tell us what is missing. Every report is read.